Fiscal reality
of the municipalities of the department of Santander in the framework of Colombia’s fiscal decentralization
process, 2004-2012
Realidad fiscal de los municipios del
departamento de Santander, en el marco del proceso de descentralización fiscal
en Colombia, 2004-2012
Realidade
fiscal dos municípios do Santander no contexto da descentralização fiscal na
Colômbia, 2004-2012
Jorge Enrique Asela Molina *
Research article
Date of reception: 11 sep 2014
Date of approval: 13 jan 2015
Abstract
This document explores the
decentralization process in Colombia through its normative framework and its
relationship to the public finances of the municipalities of the department of
Santander, by means of the analysis of the fiscal situation of local authorities
of the department during 2004-2012. For this exercise, the indicators of
intergovernmental dependence and fiscal effort have been used for reference, as
proposed by the National Department of Planning (DNP, by its acronym in
Spanish), showing, in most cases, problems in the generation of internal
resources and a high degree of dependence on transfers from the central
government.
Keywords: decentralization, the state, local
authorities, intergovernmental dependence, fiscal effort, Santander Department.
Clasificación JEL: E62, H11, H72, K00, R58.
Resumen
Este
documento explora el proceso de descentralización en Colombia desde su marco
normativo y su relación con las finanzas públicas de los municipios del
departamento de Santander, por medio del análisis de la situación fiscal de los
entes territoriales del departamento durante 2004-2012. Para este ejercicio se
toman como referencia los indicadores de dependencia intergubernamentales y
esfuerzo fiscal, planteados por el Departamento Nacional de Planeación (DNP).
Se evidencian, en la mayoría de los casos, problemas en la generación de
recursos propios y un alto grado de dependencia de las transferencias del Gobierno
central.
Palabras claves: descentralización, Estado, entes territoriales, dependencia
intergubernamental, esfuerzo fiscal, departamento de Santander.
Resumo
Este artigo
explora o processo de descentralização na Colômbia através do quadro
regulamentar que converge e sua relação com as finanças públicas dos municípios
de Santander, que através da análise da situação fiscal das autoridades locais
do departamento durante o período entre os anos de 2004-2012
, o exercício realizado com base nos indicadores de dependência e de
esforço fiscal intergovernamental levantada pelo Departamento Nacional de Planejamento
(DNP ), mostrando na maioria dos casos os problemas na geração de recursos
próprios e alto grau de dependência das transferências do governo central.
Palavras
chave: Descentralização, Estado, Entidades Territoriais, Dependência,
esforço fiscal, Santander.
INTRODUCTION
In Colombia, the development model of
the state has revolved around a highly centralized structure, which started to
show changes in the last two decades of the 20th century, as a response to the
crises that took place in the economic, political, and social sectors. These
events, added to the international tendency that fostered an alternative to
centralization as a management model for the state, allowed for the emergence
of a decentralization model in Colombia, as an option to fulfill the aforementioned
role. The decentralization process, which showed significant progress during
the eighties, would take root in the nineties with the proclamation of the
Political Constitution of 1991, an event that gave subnational entities certain
political, administrative, and fiscal autonomy (Asela,
2014).
As from the theoretical perspective
of the decentralization process, this document shows, from a normative point of
view, the evolution of the decentralization process in Colombia and its influence
on the public finances of the municipalities of the department of Santander, in
the period between the years 2004-2012. Its objective is to describe the fiscal
reality of the municipalities of the department of Santander during this period,
through the behavior of the intergovernmental dependency and fiscal effort
indicators suggested by the National Department of Planning (DNP, from now on).
The analysis of the document is
conducted in order to show the way in which the fiscal decentralization process
in Colombia has affected the public finances of the municipalities of
Santander, indicating the degree of influence the central government has over
municipal finances, and highlighting the capacity of local authorities to
generate internal resources.
The methodology implemented for the analysis of the
fiscal reality of the municipalities of the department of Santander focuses on
the study of the indicators of fiscal performance – intergovernmental
dependence and fiscal effort- suggested by the DNP during the period between
2004 and 2012. Three categories are presented for each indicator in order to
state the behavior of the municipalities in a descriptive manner:
intergovernmental dependence (no dependence, moderate dependence, total
dependence); fiscal effort (outstanding, good, bad).
In the first part of the document the
decentralization model is presented as a structure for the management of the
state, as from a theoretical perspective. In the second part, the
decentralization process in Colombia is explained, founded on the normative
framework, mainly in the fiscal field. Finally, an analysis of the fiscal
reality of the municipalities of the department of Santander between 2004 and
2012 is carried out, based on the description of intergovernmental dependence
and fiscal effort indicators.
DESCENTRALIZATION
One
of the most common definitions of decentralization is the one suggested by Rondinelli, McCullough, and Johnson (1989), which describes it as a
political-administrative reform, and defines it as “the transfer of responsibilities
of planning, management, and the raising and allocation of resources from the
central government and its agencies to territorial units” (Rondinelli
et al., 1989, p. 58-59); the aim of which is to increase the efficiency of the
public administration. At the same time, the authors make reference to the
existence of four types of decentralization: deconcentration, delegation, devolution, and privatization. First,
they present deconcentration as the transfer of
responsibilities of an administrative nature from the higher levels of central
Government to the lower levels. Delegation is understood as the handing over of
faculties to achieve greater administrative autonomy, but with financial
responsibilities over public policies, always restricted by accountability to
the central Government. Devolution is proposed as the transfer of authority and
financing from the highest level of Government to subnational agencies, which gives
the power to collect revenue through tax. Privatization consists of the
competition between public and private agencies to provide goods and services.
Over time, the evolution of the definition of the term
‘decentralization’ developed by Rondinelli et al., (1989), has led to the redefining
of the types of decentralization proposed by the aforementioned authors, and
has achieved academic consensus in “devolution” as a type of decentralization,
and in deconcentration and delegation as
characteristics of the same process (Mardonez, 2008).
For this reason, within the framework of the structural organization of states,
decentralization in more recent times has been understood as a
political-administrative process, which consists of the transfer of
responsibilities, resources, and functions from the central body of the state
towards its local authorities (Triesman, 2002).
According to Finot (2002), the
process of decentralization, as a structure for the management of the state,
has a series of objectives in the different fields of public administration,
which focus, firstly, on the political sphere, as a basis for further steps in
the administrative and fiscal fields. For Finot (2002),
the main objectives of the process of decentralization in this phase are: 1) to
generate constructive participation, 2) to increase the efficiency of the
public administration, and 3) to achieve greater territorial and social equity.
To reach these objectives, there are fundamental
factors, such as the expansion of decision centers, improved agility and
flexibility in the making of decision by the state regarding localities and an
opening towards political plurality. These measures presuppose, among other
things, better reading of the preferences of individuals, given the proximity
of local authorities and their communities, as well as a more agile
intervention in the problems that arise in localities, with the aim of
increasing the efficiency of the public administration, which is the main
objective of decentralization (Baguenard, 1994).
The decentralization process of the state can be assumed
from different perspectives or as a conglomerate of them. Cohen and Peterson
(1996) classify them according to their characteristics as: spatial, market,
political, and administrative decentralization.
- Spatial decentralization: is understood as the transfer of resources and instruments to
local authorities, with the aim of promoting economic and industrial
activities in an attempt to impede the concentration of said activities in
the main urban centers.
- Decentralization towards the market: is viewed as the transference of responsibilities regarding the
provision of goods and public services from the state to the private
sector.
- Political decentralization: lies in the free election of local authorities, in most cases by
popular vote, at the same time that these authorities have the power to
make decisions related to the development of their localities.
- Administrative decentralization: consists of the transfer of functions, resources, and decision
making capacities from the central government to local authorities, with
the objective of guaranteeing the provision of certain public goods and
services.
Administrative decentralization is manifested in: (i) deconcentration,
(ii) delegation and (iii) devolution. (i) Deconcentration
is taken to be the redistribution of decision making authority from the central
Government towards local authorities or public entities. It is a process that
takes place within an organizational unit, with a single unit of command and management, in addition it can take place in different
levels of Government (central, departmental, municipal). (ii) Delegation, as its name indicates, allows for the delegation
of faculties that grant greater administrative autonomy along with financial
responsibilities over public policies, while remaining accountable to the
central Government. Finally, (iii)
devolution consists of granting political autonomy to the two previous
processes –deconcentration and delegation- allowing
local governments to make decisions on developmental policies within their localities.
It is necessary to add one more classification to the
different manifestations of the decentralization model: fiscal
decentralization. This includes characteristics of administrative
decentralization that make them seem similar, given that both have as their
basis the transfer of resources; although there is a substantial difference
between them: the autonomy of local governments to formulate new taxes. In the
words of Falleti (2005): “fiscal decentralization
refers to a set of policies designed to increase the revenue or fiscal autonomy
of subnational governments” (Falleti, 2005, p.329).
Or, as Schneider (2003) puts it: “it refers to how
central governments hand over part of the fiscal impact to non-central
government entities” (Schneider, 2003, p.33).
According to what was previously mentioned,
decentralization can be understood as the transfer of competences from the
central Government to subnational entities, which should be accompanied by
basic conditions on the political, administrative, and fiscal level, allowing
them to assume some of the functions of the central entity.
NORMATIVE
FRAMEWORK OF DECENTRALIZATION IN COLOMBIA, FIRST STEPS AND ITS PHASES
(1983-1990), 1991 ONWARDS
First steps towards
decentralization in Colombia
Decentralization is a form of organization of the
state, in which the public administration is organized between the central
Government and subnational governments, which have tributary faculties and
expenditure allocation. This system allows for the decision-making process to
be closer to the citizen, that is to say, that it presupposes a nearing to the
power structures by the citizens. This is translated into a better
understanding of their preferences as regards public goods and services. It is
considered that a decentralized system leads to efficiency, effectiveness, and
commitment in the administration of resources and the agencies of the state (Falleti, 2005).
In Latin America, the decentralization process began
late, in comparison to other regions-the end of the eighties and beginning of
the nineties of the XX century- due to the centralist legacy inherited from colonial
times. At the beginning of the eighties, the centralist model was losing ground
in Latin America, as a consequence of the fall of the military dictatorships
that governed many of the countries of the region, after their fall and return to
democracy, reforms started to take place which transformed the panorama for
subnational entities, among which are the election of local authorities by the
people and the delegation of administrative functions from the central
Government.
Colombia is one of the countries that from the
beginning of the eighties has been consolidating the
process of decentralization towards territorial governments. The failure in the
coverage and the quality of public services (health and education) motivated
this process for which the Political Constitution established greater fiscal
and political autonomy for subnational governments, where intergovernmental
transfers and the strengthening of local democracy play a fundamental role.
For Porras (2005),
decentralization, understood as a dynamic process, has been consolidated
through the history of the country, based on principles like: specialization,
through the definition of powers between levels of government; sustainability
in the allocation of sources of revenue, as a guarantee of the correct
management of new responsibilities; responsibility in the political sense of
establishing a commitment between the government and its electors; and integral, given the convergence of
instruments in areas of a fiscal, political, and institutional nature.
According to Lleras and
Posada (1991), in fiscal terms decentralization in Colombia has its origins in
the government of Lleras Restrepo
(1966-1970). Firstly, Law 33 of 1968, in which the strengthening of sectional tax
authorities was established, allowing for the
participation of local authorities in a percentage of the tax on sales.
Secondly, with Law 46 of 1971, which was introduced after the so called
Musgrave Mission [1] that among its
conclusions suggested the need to increase the number of public goods and
services that the state should provide, and it was recommended that said
provision was carried out directly from the departments. It is for this reason
that under this law the revenue-sharing system was created[2].
According to Iregui, Ramos
and Saavedra (2001), even if the transfers under the mechanism of the
revenue-sharing system represented an
advance in terms of decentralization, the centralist scheme was kept, given
that political power was still exclusive to the central Government. This meant
that the resources of education and health, which had been managed by the
departments, were now concentrated in decentralized national institutions, such
as the Regional Educational Fund (FER, by its acronym in Spanish) and the
sectional services of health (SSS, by its acronym in Spanish)
With the government of Turbay,
which spanned from 1978 to 1982, centralist practices and a lack of regional
autonomy were again seen as problems. In the National Integration Plan proposed
by the government, decentralization was understood as a fundamental objective of
economic policy. For this, it was necessary to establish the role of
municipalities and departments in fiscal terms and, thus, allocate a better use
of their tributary base, which would generate a decrease in the dependence on
national transfers, which would take place years later.
First phase of descentralization in Colombia (1983-1900)
The first decentralization phase in Colombia was
established in the period from 1983 to 1990; it began with Law 14 of 1983,
which sought for fiscal decentralization through reforms in the structure of
municipal and departmental taxes, which would result in the strengthening of subnational
public finances. Among other reforms, the base and the rate of tax for industry
and commerce, and taxes on liquor and cigarette consumption were modified, as
well as transferring the stamp duty on motor vehicles to the departments. As a
consequence of this law, an update of the property tax base took place and road
and transit taxes were adopted; reforms that meant that this law was known as
the National Taxation statute.
This distribution of the state’s fiscal structure
among the different levels of government -mentioned above in Law 14 of 1983-,
for Lleras (1991) obeys two basic criteria: “economies
of scale in the management of taxes and the effective capacity to control
revenue collection” (Lleras & Posada, 1991, p.
64). From this, the nation should
collect on activities of mobile factors of production of the regions.
In later years, the role of the departments was
redefined, through the laws 22 of 1985 and 3 of 1986, where they were established
as intermediate instances in charge of participating and supervising the
creation and execution of the development plan.
According to Porras (2005),
in 1985, with Law 75 the regional councils of economic planning (CORPES, by its
acronym in Spanish) were created, becoming the main entities for regional planning.
With this, the strengthening of local planning, participation in the
development plans and the programming of the budget of regional entities was intended.
These objectives and norms were confusing, which was translated into a duplicity of roles and expenditure.
By the end of the eighties, great advances took place
in the political, administrative, and fiscal fields. In the political sphere,
with the Legislative Act 1 of 1986, through which the election of mayors
through popular vote is established – a law which would come into effect two
years later-, the objective was to strengthen local governments and make them
sensitive to the preferences of their inhabitants. Concerning the
administrative field, Law 12 of 1986 modified the percentage transferred to departments
and municipalities in value-added tax (VAT), in addition to the allocation and availability
for said resources, for which new competences were assigned. Moreover, through
Decree 77 of 1987 the central Government was authorized to fuse, reform or
liquidate entities that delivered the services within the transfer of
resources, the functional structure responsible for the delivery of public
services to a local level was established and a co-financing system was
created, as an instrument of public investment.
Afterwards, in 1989, also in the administrative field,
with Law 29 the power to appoint teachers and additional staff in public
schools was given to mayors, without affecting the finances of the localities,
given that the payment of those appointments would be through the central
government. With Law 57 of 1989, the Financiera de Desarrollo Territorial (Financial Institution of
Territorial Development –FINDETER, by its acronym in Spanish) was created, as
an organ to accompany and finance urban infrastructure projects on a local and
regional level.
On the other hand, in the fiscal field, the
co-financing system was established, as an instrument for public investment
(Decree 77/87), and with Law 44 of 1990 a unified property tax was structured,
authorizing councils to establish tariffs within a certain range, which would
generate more resources for local governments.
The reforms formulated in the first phase of the
decentralization process in Colombia had two objectives. According to Iregui, Ramos and Saavedra (2001), the first was the Government’s
desire to remove the responsibility of local expenditure from their budget,
given that it was facing a crisis and the deterioration of the national
finances. The second referred to the purpose of widening the coverage, as well
as improving the efficiency and quality of public expenditure, in which the
departments and municipalities would begin to play an important role. In
summary, this stage was characterized by setting the groundwork that would
strengthen the decentralization process in Colombia, presenting great advances
in the political, fiscal, and administrative planes.
Second phase of descentralization in Colombia, 1991 onwards
The second phase of the decentralization process in Colombia started
with the promulgation of the 1991 Constitution, which introduced substantial
changes to the decentralization process with regard to territorial and
political orientation, the distribution of powers and functions among the
different levels of government, the distribution of resources among the
different levels of government, planning and public budgetary processes, and
fiscal control systems.
The new Constitution (1991), in article 1, organized the country into a
“unitary, decentralized republic with autonomy of its local authorities…” It
also suggests in article 303, making reference to political decentralization, the election of governors through popular vote.
As regards the political-administrative division of the country, a
municipality is defined in article 311 of the Constitution as:
“The fundamental entity of
the political-administrative division of the state, the responsibility of which
is to provide those public services determined by law, to construct the works
required for local progress, to arrange the development of its territory, to
promote community participation, the social and cultural betterment of its
inhabitants, and to execute the other functions assigned to it by the
Constitution and its laws.”
With regards to territorial organization, possibilities were opened up to
create new territorial entities, such as:
·
Regions
·
Provinces
·
Special districts
·
Metropolitan areas
·
Indigenous territories
All these new territorial entities, according to article 287, have total
autonomy within the limits of the Constitution and the law, which guarantees
that they are governed by their own authorities. In addition, the participation
of the central Government regarding revenues is established as well as the
possibility to generate internal resources that allow them to fulfill their
functions within the framework of their powers.
On the fiscal plane, the collection of taxes by territorial entities so
as to fulfill the functions imposed in article 287 was established within the
framework of greater fiscal autonomy. Through article 362, the nation is
impeded from appropriating the resources that are collected by the territorial
entities through taxes, except in the case of an external war, and sets out the
prohibition of surcharges or exemptions to the law in relation to property
taxes (article 294).
Intergovernmental transfers, as supplements to the
budget of territorial entities, play an important role in the development of
the localities. For this, the Political Constitution of Colombia establishes the
transfers to the departments in article 356, and in article 357, the transfers
to municipalities, at the same time, articles 360 and 361 deal with topics
corresponding to the royalties.
What was stipulated in articles 356, 357, 360, and
361, focuses on the use of resources from transfers. The revenue-sharing
system can only be used in programs referring to the health
and public education sectors, the transfers to the municipalities can only be
invested in the social sector, it will not be possible to give new
responsibilities to subnational entities without a prior increase in the
resources transferred. Moreover, it is suggested that the resources coming from
the exploitation of non-renewable resources should be delivered through
royalties to the territorial entities in which the exploitation is carried out or
where the products or derivatives of such exploitation are transported by sea.
After the issuance of the Constitution of 1991, the
laws that regulate it were promulgated. Law 60 of 1993 regulates what was
established in articles 151, 288, 356, and 357 of the Magna Carta concerning
the distribution and assignation of resources, and powers. In terms of
administrative decentralization, this law dictates the powers of the
subnational entities, mainly in sectors like education,
health, housing, and basic sanitation (see Table 1). In the fiscal field, among
other dispositions, it gives the National Department of Planning control of the
assignation of transfers to territorial entities. These transfers are delivered
under a formula of distribution, giving great importance to municipalities with
less than 50 thousand inhabitants and indigenous territories. For the formulas,
variables such as population, unsatisfied basic needs, local fiscal effort and
administrative efficiency are taken into consideration.
Table
1. Powers
and functions under Law 60 of 1993, social sectors
|
|
|||||
|
|
Sector |
Central
level |
Departamental
level |
Municipal
level |
|
|
|
|||||
|
|
General role |
To formulate policies. To distribute and
transfer resources of the revenue-sharing system To manage co-financing
funds. To advise local
authorities. To evaluate service provision. |
To plan, manage and
distribute resources among municipalities. To provide financial help
and advice to the municipalities. |
To provide basic
services: health and education (in the first level), drinking water and
health care, housing, and others indicated by law. |
|
|
|
|||||
|
|
|||||
|
|
|||||
|
|
|||||
|
|
|||||
|
|
|||||
|
|
|||||
|
|
Education |
It is no longer
responsible for administrative matters related to national educators. To establish salaries
according to the law. To conduct follow-up and
evaluation services. |
To plan, manage, and
coordinate educational services. To manage and train
teachers, according to the law. To gradually transfer
functions to the municipalities. To manage co-financing
funds for the municipalities with local resources. |
To manage pre-school,
primary and secondary education, according to the terms of departmental
change. To make the necessary
investments in infrastructure, equipment, and maintenance of educational
centers. |
|
|
|
|||||
|
|
|||||
|
|
|||||
|
|
|||||
|
|
|||||
|
|
|||||
|
|
|||||
|
|
|||||
|
|
Health |
To promote and coordinate
national campaigns and programs for primary health care. To develop all the other
roles established by Law 10 of 1990. |
Services are delivered
through specialized, regional and university hospitals. To conduct campaigns together
with or thanks to the central level. To develop all the other
roles established by Law 10 of 1990. |
To promote preventive treatment
and rehabilitation for patients in the first level. To promote medical
services through local hospitals and clinics, and
through activities related to environmental health. |
|
|
|
|||||
|
|
|||||
|
|
|||||
|
|
|||||
|
|
|||||
|
|
|||||
|
|
|||||
|
|
|||||
|
|
Housing |
To promote technical help
to local entities. No longer takes on
construction programs. Provides subsidies to
municipal programs. |
|
To define the regulations
for urban development. To promote and
participate in projects of social housing. To provide housing
subsidies to those in need. |
|
|
|
|||||
|
|
|||||
|
|
|||||
|
|
|||||
|
|
|||||
|
Basic health
care |
To conduct programs of
technical assistance to local authorities. To co-finance and provide
credit.
|
|
To provide services
(directly or indirectly, through contracts with the private sector). To conduct projects for
the construction and expansions of aqueducts and sewage. To guarantee the
provision of basic rural services of health, urban cleaning, sanitation of
slaughterhouses and market places. |
||
|
|
|||||
Source: chart elaborated
by the author with information from Lleras &
Posada (1991).
Law 141 of 1994 regulates what was established in articles 360 and 361
of the Constitution, created the National Endowment Fund (FNR, by its acronym
in Spanish) and the National Commission of Endowment, develops the rule of law in
receiving royalties for the exploitation of non-renewable resources and
establishes rules for liquidation and distribution. This law is an advance of
the decentralization of the state in fiscal terms, given that the
municipalities where non-renewable resources are exploited benefit directly
from these funds.
With the objective of making fiscal adjustments to the territorial
entities, given their growing operational expenditure, laws 549 of 1999, 550 of
1999, and 617 of 2000 are promulgated, with which, among other dispositions,
departments and municipalities are classified into categories according to
their population and unallocated current revenues (ICLD, by its acronym in
Spanish). In addition, it is stipulated that operational expenditures should be
covered by the revenues generated in the tax year (internal revenues).
As advances in the fiscal level
of decentralization and as a mechanism to strengthen the revenue of the
different levels of government, laws 663 of 2000, 778 of 2002, 863 of 2003, and
1111 of 2006 are promulgated, which strengthen the tributary statute and create
new taxes, such as the tax on financial transactions (GMF, by its acronym in
Spanish), which applies nationwide.
By 2001, Law 715 established the norms that will apply
in terms of the distribution and assignation of powers established by the
National Constitution, in accordance with articles 151, 288, 356, and 357, and
established other dispositions. This law reformed the participation system,
creating the General Participation System (SGP by its acronym in Spanish and
expressed thus below), which is formed of the resources that the nation
transfers, by the mandate of articles 356 and 357 of the Political Constitution
of Colombia, to the territorial entities.
For the year 2007, there was another modification of
the SGP with Law 1176. This change was made as regards the percentages available
for the sectors of health, education, basic sanitation and safe drinkable
water, general purposes and special assignations. The distribution percentages
of the resources the central Government delivers through the SGP in the
different laws are currently as follows:
Law 60 of 1993: education, 30 %; health, 25 %; safe
drinking water and basic sanitation, 20 %; sports, culture, and recreation, 5 %,
unallocated, 20 %. This last one, -unallocated- varies according to the rural
population percentage, as per article 22 of the same law.
Law 715 of 2001: education, 58.5 %; health, 24.5 %;
general purposes, 17 %. Of the 100% of the general purpose resources,
equivalent to 17% of the resources of the SGP, they are distributed in the
following sectors as follows: safe drinking water and basic sanitation, 41%;
sport, culture, and recreation, 7%; FONPET, 10%; unallocated, 42%.
Law 1176 of 2007: education, 58.5 %; health, 24.5 %; safe
drinking water and basic sanitation, 5.4 %; general purposes, 11.6 %. Of the
100% of the resources for general purposes, which are equivalent to 11.6% of
the SGP, they are distributed in the following sectors as follows: sports,
culture, and recreation and FONPET, 83%; unallocated, 17%.
Finally, Law 1530 of 2012 modifies articles 360, 361,
and Law 141 of 1994, among other provisions, creates the General System of
Royalties (SGR by its acronym in Spanish and expressed thus below). This law
represents, in some ways, a step back in the decentralization process, as that
it centralizes the resources generated through royalties and involves the
central Government in expenditure decisions regarding said resources with the
creation of the collegiate bodies of administration and decision (órganos colegiados de administración y decisión -
OCAD).
In this second phase of decentralization in Colombia,
the legal framework that constitutes it puts forward modifications which vary
the political, fiscal, and administrative aspects of the decentralization
process. In the administrative field there has been progress with the election
of mayors and governors through popular vote, with the handing over of new
functions to local governments and an increase in their powers; in the fiscal
field, the transfer and participation in revenues of the central Government
towards the territorial entities represent the main advance in this context. It
can be said that the decentralization process in Colombia, from its origins and
passing through two phases, 1983-1990 and 1991 up to the present, is a process
that has been strengthened in political, administrative, and fiscal matters,
and that aims to adapt to the problems generated by the same process.
ANALYSIS OF
FISCAL DESCENTRALIATION IN THE MUNICIPALITIES OF THE DEPARTMENT OF SANTANDER,
ACCORDING TO THE INDICATORS OF INTERGOVERNMENTAL DEPENDENCE AND FISCAL EFFORT,
PERIOD 2004-2012
The analysis that will be presented below was carried
out using the average of the intergovernmental development and Fiscal effort
indicators as reference These were prepared by the
National Planning Department (DPN) during the period 2004-2012. For this case,
it was decided to divide the municipalities into three categories, according to
the performance of their indicators, to the end that the categories have a
descriptive component in the behavior of their municipalities in relation to
the indicators suggested for the case. For the intergovernmental dependence
indicator, the categories are: no
dependence, moderate dependence, totally dependent. In the case of the
fiscal effort indicator, the categories are: outstanding, good, bad (see Table 2). It was decided to preserve the division of the provinces of the
department of Santander with the objective of presenting a more thorough view
of the regions of the department.
Table 2.
Categories according
to indicator
|
Intergovernmental development |
Fiscal effort |
||
|
If the indicator
is ≤ 49,9% |
No dependence |
If the indicator
is ≤ 49,9% |
Outstanding |
|
If the indicator is ≥ 50% but ≤ 59,9% |
Moderate dependence |
If the indicator is ≥ 50% but ≤ 59,9% |
Good |
|
If the indicator
is ≥60% |
Totally dependent |
If the indicator
is ≥60% |
Bad |
Source: elaborated
by the author.
Presentation of
the indicators
Intergovernmental
dependence
Intergovernmental dependence shows the degree of
incidence of the different levels of Government in the public finances of
localities. It is measured according to the relation between the transfers and
the royalties received by the municipality in proportion to their total revenue
(See Table 3). The indicator measures the importance of these resources for the
financing of the municipality’s programs and reflects to what extent the
municipality depends on the transfers for the financing of their development
plan and the accomplishment of their functions and responsibilities.
Fiscal effort
The capacity of localities to generate their own
resources enters in the scheme of the handing over of powers by the central and
departmental governments. Therefore, this indicator shows the steps the
municipalities have taken in order to guarantee the development of their own
policies. The fiscal effort indicator relates tax revenues as a percentage of
total revenues (see Table 3). In this way, how the municipality is financed is
measured and if it does enough to generate its own resources to finance its
programs, or if, on the contrary, the programs depend on transfers from the
nation.
Table
3. Indicators: intergovernmental dependence and fiscal
effort
|
Topic |
Indicator |
|
Intergovernmental
dependence |
Transfers + royalties /
total revenue |
|
Fiscal
effort |
Tax revenues / total revenue |
Source: Elaborated by the author based on DNP.
Department of Santander, political
division
The department of Santander is formed of six provinces
and a total of 87 municipalities. The provinces are: Comunera, García Rovira, Guanentina,
Mares, Soto, and Vélez. They are formed
as follows:
Comunera, 16 municipalities (Chima, Confines,
Contratación, El Guacamayo, Galán, Gámbita,
Guadalupe, Guápota, Hato, Oiba, Palmar, Palmas de
Socorro, Santa Helena del Opón, Simacota, Socorro, Suaita);
García Rovira, 12 municipalities (Capitanejo,
Carcasí, Cerrito, Concepción, Encino, Guaca, Macaravita, Málaga, Molagavita,
San Andrés, San José de Miranda, San Miguel); Guanentá,
18 municipalities (Aratoca,
Barichara, Cabrera, Cepitá, Charalá, Coromoro, Curití, Encino, Jordán,
Mogotes, Ocamonte, Onzaga,
Páramo, Pinchote, San Gil, San Juaquín, Valle de San
José, Villanueva); Mares, 7 municipalities
(Barrancabermeja, Betulia, El Carmen de Chucurí, Puerto Wilches, Sabana de
Torres, San Vicente de Chucurí, Zapatoca); Soto, 15 municipalities (Bucaramanga, California, Charta, El Playón, Floridablanca, Girón, Lebrija, Los
Santos, Matanza, Piedecuesta, Rionegro, Santa Bárbara, Suratá,
Tona, Vetas); and Vélez, 19 municipalities
(Aguada, Albania, Barbosa, Bolívar, Chipatá, Cimitarra, El Peñón, Florián, Guavatá, Guepsa, Jesús María, La
Belleza, La Paz, Landázuri, Puente Nacional, Puerto Parra, San Benito, Sucre,
Vélez).
Consolidated analysis of
the municipalities of the department of Santander in the period between
2004-2012
During the period studied, the behavior of
the general average of all the municipalities of the department of Santander is
not good with reference to the intergovernmental dependence indicator, as they
reached 74.4% of dependence to the national transfers. The tendency of the
indicator is solid during almost the entire period, oscillating between 73.8%
and 78.1% (see Figure 1), 2011 being the year with the least dependence of the
municipalities. This can be explained by the boost in the fiscal effort
indicator which, during the last three years of the period analyzed, shows good
behavior in comparison to the previous years, going from 11.7%, in 2009 to
53.1% in 2010 (see Figure 2).
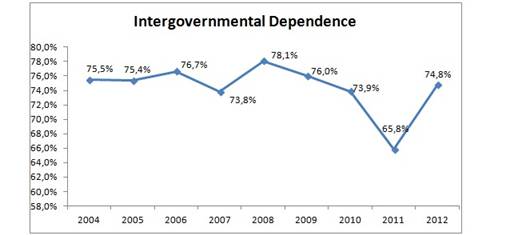
Figure 1. General average of the
municipalities of the department of Santander, intergovernmental dependence
indicator (2004-2012).
Source: elaborated by the author based
on DNP data.
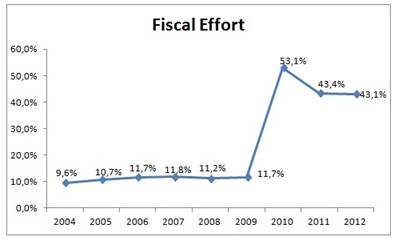
Figure 2. General average of the
municipalities of the department of Santander, fiscal effort indicator
(2004-2012).
Source: elaborated by the author based
on DNP data.
Within the
behavior of the intergovernmental dependence indicator –as we will see later
on-, of the 87 municipalities that form the department of Santander, only 13 do
not depend on the transfers of the national Government or their dependence is
moderate (see Map 1), (Bucaramanga, Barrancabermeja, Floridablanca, Girón,
Piedecuesta, San Gil, Cimitarra, Lebrija, San Vicente de Chucurí, Puerto
Wilches, Socorro, Sabana de Torres, Barichara). This is worrying, because 85%
of the municipalities during the period studied (2004-2012) are dependent on
the resources that are delivered to them through transfers and royalties in
order to fulfill their functions and responsibilities.
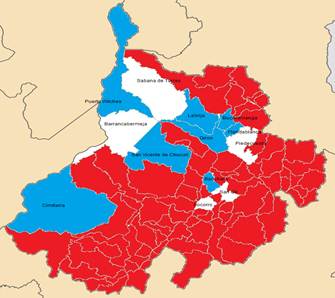
Map 1. Municipalities of the department of
Santander, according to the average of the intergovernmental dependence
indicator 2004-2012.
Source: map elaborated by the author based on DNP data. The municipalities are divided by
colours, as follows: white, no dependence
(Barrancabermeja, Piedecuesta, Sabana de Torres, San Gil, Socorro). Blue,
moderate dependence (Barichara, Bucaramanga, Cimitarra, Floridadblanca, Girón,
Lebrija, Puerto Wliches, San Vicente de Chucurí). Red, total dependence (74
remaining municipalities).
On the other
hand, the fiscal effort indicator presents an even more worrying panorama, as
only 5.7% of the municipalities of the department of Santander have an
outstanding or good effort in the generation of internal resources (see Map 2)
(Barrancabermeja, Bucaramanga, Floridablanca, Piedecuesta, San Gil), which
shows that there is still a lot to do regarding the subject. At the same time,
the behavior of the indicator impedes the improvement in the quality of life of
the inhabitants of the municipalities of the department, given that only 18% of
the municipalities have an unsatisfied basic needs (UBN) index that is lower
than 25% (see Table 13).
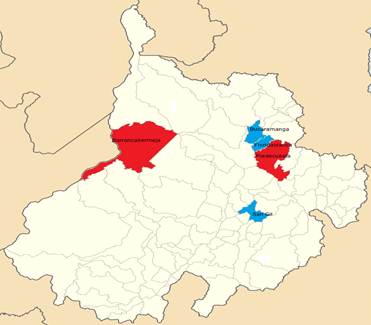
Map 2. Municipalities of the department of
Santander, according to the average of the fiscal effort indicator 2004-2012.
Source: map elaborated by the author based on DNP data. The
municipalities are divided by colors, as follows: red, municipalities with
outstanding fiscal effort (Barrancabermeja, Piedecuesta); blue, good fiscal
effort (Bucaramanga, Floridablanca, San Gil); white, bad fiscal effort (82
remaining municipalities).
Below there is an analysis of the indicators
per province which will show more extensively the behavior of the municipalities
of the department of Santander in the light of intergovernmental dependence and
fiscal effort indicators in the period 2004-2012.
Analysis per province
Comunera Province
The analysis of the indicators in the Comunera Province shows a pronounced dependence on the
resources of transfers and royalties of the different levels of Government. At
the same time, the generation of internal resources is really poor and cannot
guarantee the correct functioning of the municipal administrations, a situation
that can be seen in Table 4.
The intergovernmental dependence indicator shows that
out of the 16 municipalities that form the Comunera Province,
only the municipality of Socorro shows independence from the resources of the
central and departmental levels to finance their policies. On a 9-year average,
the resources from transfers and royalties were reached 44.22% of the total budgeted
revenues.
As regards the fiscal effort indicator, the Comunera Province demonstrates bad management in generating
own resources, due to the fact that none of the municipalities has an index
that shows an effort higher than 49.99%, Socorro being the closest to the goal,
with 43.99% (see Table 4).
Table 4. Municipalities
of the Comunera province according to the
intergovernmental dependence and fiscal effort indicators
|
Comunera Province |
||
|
Municipality |
Intergovernmental dependence |
Fiscal effort |
|
Chima |
85,68 % |
10,28 % |
|
Confines |
76,52 % |
20,99 % |
|
Contratación |
81,37 % |
13,67 % |
|
El Guacamayo |
81,77 % |
11,8 % |
|
Galán |
76,2 % |
13,03 % |
|
Gambita |
80,31 % |
18,47 % |
|
Guadalupe |
74,42 % |
23,04 % |
|
Guapotá |
80,26 % |
23,2 % |
|
Hato |
86,44 % |
9,61 % |
|
Oiba |
67,42 % |
30,56 % |
|
Palmar |
86,35 % |
9,84 % |
|
Palmas del Socorro |
76,8 % |
17,72 % |
|
Santa Helena del Opón |
88,15 % |
13,74 % |
|
Simacota |
79,15 % |
21,09 % |
|
Socorro |
44,22 % |
43,99 % |
|
Suaita |
69,59 % |
28,91 % |
Source: elaborated
by the author based on DNP data.
García Rovira Province
The García Rovira Province is the one that has the worst performance
in the department, as regards the behavior of the intergovernmental dependence
and fiscal effort indicators, as all of the municipalities that form it are
totally dependent on the resources of transfers and royalties delivered by the
departmental and central governments (see Table 5). The municipality of Malaga
is the closest to becoming free of such dependence with a 62.06% of their total
revenues coming from the higher levels of the Government.
Table
5. Municipalities
of the García Rovira
province according to the intergovernmental dependence and fiscal effort
indicators
|
García Rovira Province |
||
|
Municipality |
Intergovernmental dependence |
Fiscal effort |
|
Capitanejo |
78,7 % |
16,96 % |
|
Carcasí |
92,03 % |
9,07 % |
|
Cerrito |
81,02 % |
15,49 % |
|
Concepción |
78,19 % |
15,85 % |
|
Enciso |
85,96 % |
11 % |
|
Guaca |
88,85 % |
12,68 % |
|
Macaravita |
85,24 % |
10,78 % |
|
Málaga |
62,06 % |
37,32 % |
|
Molagavita |
81,88 % |
10,64 % |
|
San Andrés |
73,43 % |
21,52 % |
|
San José de Miranda |
85,44 % |
14,2 % |
|
San
Miguel |
90,77 % |
9,42 % |
Source: elaborated by the author based on DNP data.
Guanentá Province
The Guanentá Province has 18
municipalities, of which Barichara exhibits moderate
dependence in the intergovernmental dependence indicator, this being 57.83% but
concerning fiscal effort its index is 29.02%, which shows another type of
financing for the programs of its development plan. On the other hand, the
municipality of San Gil has no dependence on the resources of royalties and
transfers in financing their public policies; moreover, the fiscal effort made
by the municipality allows it to have a favorable indicator, because 57.39% of its
total revenue comes from tax revenues. The majority of the municipalities of
this province show total dependence and bad behavior in the generation of their
own resources (see Table 6).
Table
6. Municipalities
of the Guanentá province according to the
intergovernmental dependence and fiscal effort indicators
|
Guanentá Province |
||
|
Municipality |
Intergovernmental dependence |
Fiscal effort |
|
Aratoca |
76,43 % |
18,81 % |
|
Barichara |
57,87 % |
29,02 % |
|
Cabrera |
84,38 % |
12,98 % |
|
Cepitá |
92,17 % |
9,44 % |
|
Charalá |
67,24 % |
28,73 % |
|
Coromoro |
83,07 % |
15,58 % |
|
Curití |
77,8 % |
21,33 % |
|
Encino |
84,35 % |
13,09 % |
|
Jordán |
92,47 % |
8,87 % |
|
Mogotes |
82,98 % |
18,22 % |
|
Ocamonte |
78,06 % |
17,21 % |
|
Onzaga |
84,24 % |
12,78 % |
|
Páramo |
77,74 % |
25,07 % |
|
Pinchote |
71,74 % |
30,75 % |
|
San Gil |
36,51 % |
57,39 % |
|
San Joaquín |
84,81 % |
9,79 % |
|
Valle de San José |
79,3 % |
17,91 % |
|
Villanueva |
78,34 % |
18,83 % |
Source:
elaborated by the author based on DNP data.
Mares Province
The Mares Province has the best performance as regards
the intergovernmental dependence indicator in the department of Santander,
given that 57% of the municipalities of which it is formed do not show
dependence or show moderate dependence (see Table 7). Barrancabermeja and Sabana de Torres are the ones that have the best index in
the province with 35.11% for the former -the best of the department- and 42.08%
for the latter. The municipalities of Puerto Wilches
(52.3% of their total revenue) and San Vicente de Chucurí
(51.3%) show moderate dependence on the revenues from the central and
departmental levels and royalties.
Regarding
the fiscal effort indicator, the municipality of Barrancabermeja presents the best index in the province and, at the same
time, in the department: 66.7% of its total revenue corresponds to that coming
from tax collection. The other municipalities have a really poor index, a
situation that puts them in a bad position as regards the generation of internal
resources.
Table 7.
Municipalities of the Mares province according to the intergovernmental
dependence and fiscal effort indicators
|
Mares Province |
||
|
Municipality |
Intergovernmental dependence |
Fiscal effort |
|
Barrancabermeja |
35,11 % |
66,7 % |
|
Betulia |
74,03 % |
30,19 % |
|
El Carmen de Chucurí |
72,51 % |
22,03 % |
|
Puerto Wilches |
52,3 % |
30,32 % |
|
Sabana de Torres |
42,08 % |
36,34 % |
|
San Vicente de Chucurí |
51,3 % |
37,18 % |
|
Zapatoca |
60,51 % |
25,78 % |
Source:
elaborated by the author based on DNP data.
Soto Province
In the Soto Province, where Bucaramanga is located,
the capital of the department, the intergovernmental dependence indicator has
good behavior in the municipalities that form the metropolitan area of
Bucaramanga, (Bucaramanga, Floridablanca, Piedecuesta, Girón).
The municipality of Piedecuesta has an index of 46.31%,
which positions it among the municipalities with no dependence on resources of
transfers and royalties. The municipalities of Bucaramanga (50.02%), Floridablanca (52.71 %), Girón
(59.13) % and Lebrija (58.83 %) have moderate
dependence on these types of resources.
The rest of the municipalities are totally dependent (see Table 8).
As regards the fiscal effort indicator, once again the
municipality of Piedecuesta appears as the best in
the province with an index of 60.87%, showing outstanding management in the
generation of its own resources. At the same time, the municipalities of
Bucaramanga and Floridablanca demonstrate good
performance in the generation of their own resources with indexes of 56.58% and
52.71, respectively. It is important to highlight that, even though the
municipalities of Girón (47.86 %) and Lebrija (44.5 %) do not show good performance in the
generation of internal resources, their indexes are close to taking them to
that position; the municipalities have a really low index (see Table 8).
Table 8.
Municipalities of the Soto province according to the intergovernmental
dependence and fiscal effort indicators
|
Soto Province |
|
||||
|
Municipality |
Intergovernmental dependence |
Fiscal effort |
|||
|
Bucaramanga |
50,02 % |
56,58 % |
|
||
|
California |
70,48 % |
18,85 % |
|
||
|
Charta |
87,96 % |
9,61 % |
|
||
|
El Playón |
84,11 % |
19,69 % |
|
||
|
Floridablanca |
57,18 % |
52,71 % |
|
||
|
Girón |
59,13 % |
47,86 % |
|
||
|
Lebrija |
58,83 % |
44,5 % |
|
||
|
Los Santos |
69,06 % |
35,56 % |
|
||
|
Matanza |
84,28 % |
12,86 % |
|
||
|
Piedecuesta |
46,31 % |
60,87 % |
|
||
|
Rionegro |
65,22 % |
33,13 % |
|
||
|
Santa Bárbara |
85,64 % |
10,54 % |
|
||
|
Suratá |
84,09 % |
10,43 % |
|
||
|
Tona |
75,99 % |
22,92 % |
|
||
|
Vetas |
76,46 % |
15,23 % |
|
||
Source:
elaborated by the author based on DNP data.
Velez Province
The Velez Province registers the tendency of most of
the municipalities of the department in both indicators. Concerning the
intergovernmental dependence indicator, the municipality of Cimitarra
stands out, given that it is the only one that has moderate dependence in the
composition of its total revenue received through transfers and royalties (its
index is 50.45%). The rest of the municipalities are totally dependent on the
resources provided by the different levels of the government.
In the fiscal effort indicator, the entire province performs
badly, because the indexes of the indicator show an insufficient effort on the
part of the municipalities to generate greater volumes of internal resources.
It is important to highlight the progress of municipalities such as Cimitarra and Barbosa, which, given their indexes of 47.62%
and 43.67%, are the closest to performing well in the generation of resources.
Table 9. Municipalities of the Velez province
according to the intergovernmental dependence and fiscal effort indicators
|
Provincia de Vélez |
||
|
Municipality |
Intergovernmental dependence |
Fiscal effort |
|
Aguada |
85,45 % |
12,82 % |
|
Albania |
80,1 % |
11,45 % |
|
Barbosa |
67,21 % |
43,67 % |
|
Bolívar |
86,27 % |
18,16 % |
|
Chipatá |
80,5 % |
15,9 % |
|
Cimitarra |
50,45 % |
47,62 % |
|
El Peñón |
91,67 % |
8,57 % |
|
Florián |
65,62 % |
28,63 % |
|
Guavatá |
73,92 % |
19,81 % |
|
Guepsa |
74,82 % |
25,2 % |
|
Jesús María |
77,47 % |
15,99 % |
|
La Belleza |
76,41 % |
25,32 % |
|
La Paz |
84,31 % |
14,14 % |
|
Landázuri |
74,75 % |
23,26 % |
|
Puente Nacional |
64,6 % |
36,03 % |
|
Puerto Parra |
59,96 % |
34,4 % |
|
San Benito |
84,12 % |
14,63 % |
|
Sucre |
88,74 % |
12,09 % |
|
Vélez |
69,73 % |
33,08 % |
Source:
elaborated by the author based on DNP data.
After making an analysis of the indicators
per province, some peculiarities within the behavior of the indicators in the
municipalities become evident; variables like population, geographic extension,
and province, which turn out to be influential in the behavior of the
indicators in these localities.
As we have seen before, the department of
Santander has 13 municipalities that show no dependence or have moderate
dependence as regards the resources received from the central and departmental
governments through transfers and royalties. This can be explained
demographically, given that out of the 13 municipalities with the highest
population of the department (see Table 10), 11 are among the municipalities without
or with moderate dependence on these types of resources, Sabana
de Torres and Barichara being the exceptions. In
addition to this, of the 5 municipalities whose fiscal effort indicator is
outstanding or good, all of them are among the 6 municipalities with the
highest population within the department, which demonstrates a clear relationship
between population and resource generation.
Table 10. Municipalities of the department of Santander with
greater population
|
Province |
Municipality |
Population |
|
Soto |
Bucaramanga |
526056 |
|
Soto |
Floridablanca |
263041 |
|
Mares |
Barrancabermeja |
191718 |
|
Soto |
Girón |
166115 |
|
Soto |
Piedecuesta |
139178 |
|
Guanentá |
San Gíl |
44937 |
|
Vélez |
Cimitarra |
41375 |
|
Soto |
Lebrija |
36138 |
|
Mares |
San
Vicente de Chucurí |
34250 |
|
Mares |
Puerto
Wilches |
31503 |
|
Comunera |
Socorro |
30142 |
|
Vélez |
Barbosa |
27877 |
|
Soto |
Rio negro |
27775 |
Source:
elaborated by the author based on DANE data.
Another peculiarity is centered on Pening’s (2003) affirmation that the public finances of
local authorities depend on their size, that is to say that the generation of internal
resources is correlated with the size of the locality.
In the case of the municipalities of the
department of Santander, it is possible to see that, in some way, this
condition is satisfied, given that out of the 13 municipalities that do not
show dependence or whose dependence on resources from transfers or royalties is
moderate, 7 are among the 15 municipalities with greater territorial extension,
which are: Cimitarra,
Puerto Wilches, Barrancabermeja, Sabana
de torres, San Vicente de Chucurí,
Girón, and Lebrija, (see
Table 11). This shows that there is certain relationship between the size of
the municipality and its dependence on the transfers made to the localities.
Additionally, most of the municipalities without or with moderate dependence
are concentrated in the provinces of Soto (Bucaramanga, Floridablanca,
Girón, Piedecuesta, Lebrija) and Mares (Barrancabermeja, San Vicente Chucurí, Puerto Wilches, Sabana de Torres), provinces that contain the main urban
centers of the department and the municipalities with the greatest economic
activity, mainly in the municipalities of Soto Province which form the
metropolitan area of Bucaramanga and the city of Barrancabermeja. This shows
that the main development axis of the department is located in the north-east,
which can be inferred from the results of the fiscal effort indicator, where 4
out of 5 municipalities are from that area of the department (see Table 12).
Table 11. Municipalities of the department of Santander without or with moderate
intergovernmental dependence according to its territorial extension (km²)
|
Province |
Municipality |
Population |
Area Km2 |
Position according to extension |
|
Soto |
Bucaramanga |
526056 |
154 |
49 |
|
Soto |
Floridablanca |
263041 |
101 |
63 |
|
Mares |
Barrancabermeja |
191718 |
1274 |
3 |
|
Soto |
Girón |
166115 |
684 |
11 |
|
Soto |
Piedecuesta |
139178 |
481 |
19 |
|
Guanentá |
San Gil |
44937 |
150 |
51 |
|
Vélez |
Cimitarra |
41375 |
2847 |
1 |
|
Soto |
Lebrija |
36138 |
541 |
15 |
|
Mares |
San
Vicente de Chucurí |
34250 |
1104 |
7 |
|
Mares |
Puerto
Wilches |
31503 |
1588 |
2 |
|
Comunera |
Socorro |
30142 |
131 |
55 |
|
Mares |
Sabana de
Torres |
19077 |
1153 |
6 |
|
Guanentá |
Barichara |
7352 |
134 |
54 |
Source:
elaborated by the author based on DANE data.
Table 12. Municipalities of the department of Santander with outstanding or good
fiscal effort
|
Province |
Municipality |
Population |
Area Km2 |
Position according to extension |
|
Mares |
Barrancabermeja |
191718 |
1274 |
3 |
|
Soto |
Bucaramanga |
526056 |
154 |
49 |
|
Soto |
Floridablanca |
263041 |
101 |
63 |
|
Soto |
Piedecuesta |
139178 |
481 |
19 |
|
Guanentá |
San Gil |
44937 |
150 |
51 |
Source:
elaborated by the author based on DANE data.
Using the categorization of the quality of
life index for the year 2012 of the DANE (lower than 25%, higher than 25% but
lower than 50% and higher than 50%), it was found that out of the 87
municipalities that form the department of Santander, only 18 have an index
that is lower than 25%, representing 18% of the municipalities of the
department (see table 13). Of these 16 municipalities, most of them are located
in the province of Soto - Bucaramanga, Floridablanca,
Girón, Piedecuesta, Tona, Vetas- and in the
metropolitan area of Bucaramanga, which is part of the same province. Soto
Province is the one that has the best UBN, given that for the year 2012 all of it’s municipalities were below 50%, closely followed by the
province of Mares, in which only one municipality is above 50% in the index (El
Carmen de Chucurí with 51,08 %). In contrast to the
behavior of these two provinces (Soto and Mares), the remaining provinces (Comunera, García Rovira, Guanentá, Vélez) do not show a good UBN, with most of the
municipalities that form them between 25% and 49.9%. It is worth indicating
that 67% of the municipalities of the department (58) have an index higher than
25% but lower than 50%, and that only 15%, corresponding to 13 municipalities
are above 50% (see table 13).
In relation to the quality of life in the
municipalities of the department of Santander (UBN) and the indicators of
intergovernmental dependence and fiscal effort for the year 2012, a direct
relationship was found among the municipalities that have a UBN index lower
than 25% and those with a better fiscal effort indicator. Out of the 16
municipalities that have a UBN lower than 25%, 11 show outstanding or good
fiscal effort (see Table 14) and 7 out of those 11 appear among the most
populated municipalities of the department (Bucaramanga, Floridablanca,
Barrancabermeja, Girón, Piedecuesta,
San Gíl, Barbosa).
.
Concerning the relation between the UBN and
the intergovernmental dependence indicator for 2012, it is observed that half
of the municipalities (8) that have a UBN lower than 25% do not show dependence
(Bucaramanga, Barrancabermeja, San Gil, Socorro) or their dependence is
moderate (Floridablanca, Girón,
Málaga, Zapatoca), and the
rest are totally dependent (Barbosa, Charalá, Guapotá, Ocamonte, Piedecuesta, Pinchote, Tona, Vetas), (see Table 14),
which shows the importance of the resources that the central Government
delivers to the municipalities for investment in social sectors through SGP and
SGR.
Table 13. Distribution of municipalities per province
according to UBN, year 2012
|
Province |
UBN <25% |
UBN >25% but <50% |
UBN >50% |
|
Comunera |
2 |
12 |
2 |
|
García
Rovira |
1 |
7 |
4 |
|
Guanentina |
4 |
12 |
2 |
|
Soto |
6 |
9 |
0 |
|
Mares |
2 |
4 |
1 |
|
Vélez |
1 |
14 |
4 |
|
Total |
16 |
58 |
13 |
|
% |
18% |
67% |
15% |
Source:
elaborated by the author based on DANE and DNP data.
Table 14. Municipalities with UBN below
25% in relation to fiscal effort and intergovernmental dependence indicators,
year 2012.
|
Province |
Municipality |
UBN % |
Fiscal effort |
Intergovernmental dependence |
|
Soto |
Bucaramanga |
11,55 |
Outstanding |
No dependence |
|
Vélez |
Barbosa |
18,80 |
Outstanding |
Total dependence |
|
Mares |
Barrancabermeja |
22,33 |
Outstanding |
No dependence |
|
Guanentá |
Charalá |
24,08 |
Good |
Total dependence |
|
Soto |
Floridablanca |
9,43 |
Outstanding |
Moderate dependence |
|
Soto |
Girón |
15,37 |
Outstanding |
Moderate dependence |
|
Comunera |
Guapotá |
21,67 |
Bad |
Total dependence |
|
García
Rovira |
Málaga |
21,24 |
Outstanding |
Moderate dependence |
|
Guanentá |
Ocamonte |
24,79 |
Bad |
Total dependence |
|
Soto |
Piedecuesta |
14,36 |
Outstanding |
Total dependence |
|
Guanentá |
Pinchote |
22,62 |
Outstanding |
Total dependence |
|
Guanentá |
San Gíl |
11,14 |
Outstanding |
No dependence |
|
Comunera |
Socorro |
15,07 |
Bad |
No dependence |
|
Soto |
Tona |
24,10 |
Good |
Total dependence |
|
Soto |
Vetas |
20,80 |
Bad |
Total dependence |
|
Mares |
Zapatoca |
18,11 |
Bad |
Moderate dependence |
Source:
elaborated by the author based on DANE and DNP data.
The analysis of the indicators of intergovernmental
dependence and fiscal effort in the municipalities of the department of
Santander during the period 2004-2012 describes the high dependence of
municipalities on resources from transfers, given that the fiscal effort is not
strong enough to break said dependence. In the same way, the analysis
demonstrates that the best indicators of the municipalities in the department
are found in the municipalities of the metropolitan area and its influence zone
(Bucaramanga, Floridablanca, Girón,
Piedecuesta, Barrancabermeja), the ones that have the
largest populations (see Table 10), and the best quality of life (see Table
14).
CONCLUSIONS
Decentralization, as a structuring and development
model of the state, showed great progress in the last decades of the XX century.
The advances in research on the concept have allowed for the development and
consolidation of decentralization as an organization alternative for nations.
The changes in the political, administrative, and fiscal contexts have made it possible
that subnational entities have greater autonomy in decision-making processes as
regards problems that appear in their territories, considerably improving
efficiency in public administration.
In Colombia, the decentralization process was
consolidated in the nineties. The importance of this consolidation lay in the
passing of the political power to local authorities, as well as giving power
and responsibilities to the lower levels of the government. The formulation of
a normative framework which supported what was proclaimed in the Political
Constitution of 1991 became a main priority to give a solid grounding to the
process. The promulgation of laws, such as Law 60 of 1993, Law 141 of 1994, and
their modifications (Law 1176 of 2007 and Law 1530 of 2012) show the
adaptability and the steps that the decentralization process has taken in the
country.
The analysis of the intergovernmental dependence
indicator for the municipalities in the department of Santander during the
period studied showed a high level of dependence of the municipalities on the
resources that the central Government provides through SGP and royalties,
showing an average dependence over the years of the period studied, of 74.4% on
the revenues mentioned. Of the total of the municipalities, only 15% do not show
dependence on these resources, or show a moderate one. In the same way, the
provinces that have a greater level of dependence are: Velez, Guanentá, Comunera, and García Rovira, the last being the
one with the worst performance, given that all the municipalities that form it
show dependence.
The analysis of the behavior of the fiscal effort
indicator, for the municipalities of the department of Santander during the
studied period, showed a poor performance in the generation of internal
resources, exhibiting an indicator average of 22.9%. Of the total of the
municipalities that form the department, only 5.7% have an outstanding or good
fiscal effort. The province of Soto is the one that has the best performance, as
three of its municipalities are among the five which have outstanding or good
fiscal effort.
Looking at the possible relationship between the
indicators and variables, such as population, geographic extension, and quality
of life, it was found that there is a correlation between the municipalities
that have moderate to no intergovernmental dependence, given that out of the 13
municipalities in this condition, 11 are among the most populated. In the same
way, said correlation occurs with the fiscal effort indicator, because out of
the 5 municipalities with outstanding or good fiscal effort in the department,
they are all found among 6 most populated municipalities. As regards geographic
extension, 7 out of the 13 municipalities without or with moderate dependence
are among the 15 with the greatest geographic extension in the department. For
the fiscal effort indicator, there is no clear relation between geographic
extension and the fiscal effort of the municipalities.
The results between the fiscal effort indicator and
the UBN in the year 2012, indicated that out of the
total of the municipalities of the department: 16 present a UBN lower than 25%,
67 higher than 25% but lower than 50%, and 15 higher than 50%. The province of
Soto shows the best performance with 6 municipalities, of which 4 are part of
the metropolitan area of Bucaramanga (Bucaramanga, Floridablanca,
Girón, Piedecuesta).
As regards the intergovernmental dependence indicator, it was shown that the
relationship that exists between municipalities without or with moderate
dependence is not that close, given that even when half of the municipalities
with a UBN lower than 25% satisfy said condition, the other half is totally
dependent, which makes it possible to see the importance of the transfer
resources and royalties for the financing of social sectors.
REFERENCES
Asela, J. (2014). La descentralización en Colombia.
¿Realidad o espejismo? Consideraciones sobre la actualidad del proceso. Revista CEA, 1(1), 65-74.
Baguenard, J. (1994).
La décentralisation
(4 ed.). Colección: Que sais-je? no. 1879. París: Presse
Universitaire de France.
Cohen, J. &
Peterson, S. (1996). Methodological issues
in the analysis of decentralization. Cambridge, MA: Harvard Institute for International Development.
Constitución Política de Colombia (2012). Bogotá: Legis.
Departamento Administrativo Nacional de
Estadística. (2010). Estimación y
proyección de población nacional, departamental y municipal total por área
1985-2020. Recuperado de:
Departamento Administrativo Nacional de
Estadística. (2012). Necesidades básicas
insatisfechas –NBI, por total, cabecera y resto según municipio y nacional. A junio
de 2012.
Recuperado
de: https://www.dane.gov.co/files/censos/resultados/NBI_total_municipios_30_Jun_2012.xls
Departamento Nacional de Planeación. (2014). Contratos Plan. Recuperado de https://www.dnp.gov.co/Contratos-Plan
Departamento Nacional de Planeación. (2014). Desempeño Fiscal. Recuperado de https://www.dnp.gov.co/programas/desarrollo-territorial/evaluacion-y-seguimiento-de-la-descentralizacion/Paginas/desempeno-fiscal.aspx
Falleti, T. (2005). A sequential theory of decentralization: Latin American cases in
comparative perspective. American
Political Science Review. 99(3), 327-346.
Finot, I. (2002). Descentralización
y participación en América Latina: una mirada desde la economía. Revista de la CEPAL, 78, 139-149.
Garay, J. (1994). Descentralización,
bonanza petrolera y estabilización. Bogotá: FESCOL.
Iregui, A, Ramos, J. & Saavedra, L. (2001)
Análisis de la descentralización
en Colombia. Recuperado de http://www.banrep.gov.co/docum/ftp/borra175.pdf
Lleras, C. & Posada, J. (1991). Descentralización política, fiscal y administrativa después de la
Constitución de 1991. Bogotá: Presencia.
Mardonez, R. (2008). Descentralización: una definición y una evolución de la
agenda legislativa chilena (1990-2008). Revista
Eure, 34(102), 39-60.
Pening, J. (2003). Evaluación del proceso de descentralización en Colombia. Economía y Desarrollo, 2(1), 123-149.
Porras, O. (2005, abril). La descentralización en
Colombia: estado actual y perspectivas. En Seminario internacional Descentralización: transformación del
régimen político y cambio en el modelo de desarrollo, Bogotá, Colombia.
Rondinelli, D., Mccullough, J. &
Johnson, R. (1989). Analyzing decentralization policies in developing countries:
political-economy framework. Development and Change, 20(1) 57-87.
Schneider, A. (2003).
Decentralization: conceptualization and measurement. Studies in Comparative International Development, 30(3) 32-56.
Treisman, D. (2002). Defining and measuring decentralization: a
global perspective. Working paper. California: University of California.